Category Archives: Web Development

ASP & PHP, E-Commerce, Flash Tools, HTML Tools, Java & JavaScript, Log Analysers, Other, Site Administration, Wizards & Components, XML/CSS Tools

AnyStock Stock and Financial JS Charts 8.7.0

Type: Shareware
Cost: $49
Size: 17.81 MB
Release date: Aug 08 2019
Platform: WinXP,Win7 x32,Win7 x64,Windows 8,Windows 10,WinServer,WinOther,WinVista,WinVista x64,Linux,Linux Console,Linux Gnome,Linux GPL,Linux Open Source,Mac OS X,Android,iPhone,iPad,iOS
Publisher’s Site:  http://www.anychart.com
Publisher’s Product Page:  http://www.anychart.com/products/anystock/overview/
Country: United States of America


AnyStock Stock and Financial JS Charts

AnyChart Stock and Financial JS Charts (short: AnyStock) is a JavaScript based financial and stock charting library, also used for visualizing any timeline data over a long time. AnyStock technology turns your real-time data into highly sophisticated charts with interactive features, bringing visualization of your data to the Web and providing a full feature set for creating real-time streaming and data manipulation applications.

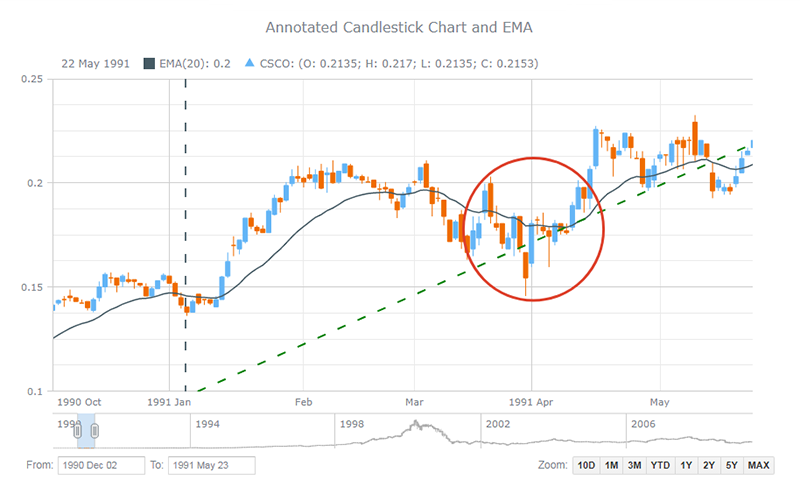
Designed to display date and time based information, AnyStock is the ideal tool for client reporting and performance reporting applications. Reports and Dashboards are visualized with scrolling, drill downs, panning and zoom functionality available in all of our HTML5 charts. AnyStock brings analysis of your FOREX, commodity and investment market data to life. The ability to review long term and large data sets can easily be handled with scroll, pan, and zoom controls.

AnyStock is fully integrated into AnyChart 7 Framework and shares most of its ideology, settings technique and ease of use – and you can use AnyStock along other charts including those available in the AnyChart JavaScript Charts, AnyGantt JavaScript Gantt Charts, and AnyMap JavaScript Maps.

AnyStock supports a wide range of stock chart types (including Candlestick, OHLC, Line, Spline, Column, Step Line, Area, Step Area, Spline Area, Marker, Range Column, Range Area, Range Spline Area, Stacked Stock JS charts) and technical analysis indicators (MACD, ROC, RSI, SMA, EMA, DMI, CHO, CCI, and others; customs indicators can be set up). Drawing tools (including Line segment, Ray, Trend line, Trend channel, Andrew’s pitchfork, Fibonacci fan, Buy/Sell signals, and many others) and adding of news events (analyst opinions, insider trading, dividends, and key developments) to improve the ability to analyze information effectively are also available and have made an important contribution to the superfast HTML5 visualization of stock/financial or any timeline data w/ AnyStock JS.

VisualNEO Web 19.11.7

Type: Shareware
Cost: $70
Size: 39.97 MB
Release date: Nov 07 2019
Platform: Win2000,WinXP,Win7 x32,Win7 x64,Windows 8,Windows 10,WinServer,WinOther,WinVista,WinVista x64
Publisher’s Site:  https://visualneo.com/contact
Publisher’s Product Page:  https://visualneo.com/product/visualneo-web
Country: Spain


VisualNEO Web

Create and publish your own WebApps and Mobile Apps with VisualNEO for Web & Mobile.
Combine quickly text, pictures, sound, video, HTML content, Internet links, special effects and other elements to create interactive, professional Web and Mobile Apps. Even if you dont know modern web technologies such as HTML5, CSS3, JavaScript or JQuery you can create awesome applications thanks to our drag and drop visual interface and our easy to learn NEO scripting language. Perfect for students and designers.

If you are already an expert web developer, you will find in VisualNEO for Web & Mobile interesting possibilities to develop professional Apps quicker integrating your favourite libraries directly or through plugins and their own wizards. You can even create and sell your own plugins within VisualNEOs marketplace. A plugin maker is already included!

Rapid Application Development:

VisualNEOs easy-to-use, floating tool palette and wizards allow you to construct many types of web based applications using simple drag and drop commands. Its easy to add, command buttons, text, entry fields, check boxes, lists and other interactive controls. Quickly create an interface that allows users to move through different app screens, enter responses, pop up messages, play multimedia files, perform calculations, send information to a server, display Internet sites, and much more.
Up to 13 plugins and many samples and tutorials included!

Easy to Learn Programming Language:

NEO scripting language, a built-in scripting language and a variety of plug-ins are also available to extend the capabilities of VisualNEO Web even further.
No programming knowledge is needed to produce many types of Web based Applications, but authors who possess even a limited knowledge of programming or want to learn how to program, can access the built-in NEO scripting language to extend the capabilities of VisualNEO even further. You can use it alone, with JavaScript or just JavaScript.

OrgChart JS 4.9.7

Type: Shareware
Cost: $399
Size: 51.00 kB
Release date: Jul 16 2019
Platform: WinXP,Win7 x32,Win7 x64,Windows 8,Windows 10,WinServer,WinOther,WinVista,WinVista x64,Linux,Linux Console,Linux Gnome,Linux GPL,Linux Open Source,Mac OS X,Android,iPhone,iPad,iOS
Publisher’s Site:  https://balkangraph.com
Publisher’s Product Page:  https://balkangraph.com/
Country: Bulgaria


OrgChart JS

OrgChart JS is designed for making neat flowcharts using HTML5, CSS, and JavaScript. Using server-side components, developers can implement a specially crafted editing interface. To create unique appearance for your app, you can make use of a set of default skins and color palettes or make your own set. If your users work with big diagrams, a search field which allows finding a particular item will serve as a handful tool.

The edit mode makes it easy to create and edit diagram items. All you have to do is type a name, title, some additional info, and OrgChart JSwill build your diagram automatically. If you work with a big data set, you can collapse your diagram leaving only the part you are working with. OrgChart JS has a zooming and scrolling features One of the best things about OrgChart JS is that it does not require any special programming skills due to simple configuration syntax.

OrgChart JS features the ability to build organization charts of any complexity. An organizational chart represents the most natural way of displaying the hierarchical structure of an organization. You can use it to show the structure of a company, business, or project team.

OrgChart JS allows you to export your chart/diagram to CSV or SVG using our export service.

OrgChart JS component consists of nodes and connectors. You can use nodes of some particular type: just textual, with an image or any other custom HTML and SVG elements, or create your own. Creation of a unique style for your diagram will be easy. The look and behavior are fully customizable, so you can set up any appearance you need via CSS or object properties.

You can easily integrate this OrgChart JS library in any web app. It supports the data loading in the JSON format, and can be used with any server-side back-end.