Category Archives: Web Development

ASP & PHP, E-Commerce, Flash Tools, HTML Tools, Java & JavaScript, Log Analysers, Other, Site Administration, Wizards & Components, XML/CSS Tools

AnyGantt JS Gantt Charts 8.6.0

Type: Shareware
Cost: $49
Size: 17.75 MB
Release date: May 14 2019
Platform: WinXP,Win7 x32,Win7 x64,Windows 8,Windows 10,WinServer,WinOther,WinVista,WinVista x64,Linux,Linux Console,Linux Gnome,Linux GPL,Linux Open Source,Mac OS X,Android,iPhone,iPad,iOS
Publisher’s Site:  http://www.anychart.com
Publisher’s Product Page:  http://www.anychart.com/products/anygantt/overview/
Country: United States of America


AnyGantt JS Gantt Charts

AnyGantt JS Gantt Charts library is an advanced JavaScript-based data visualization solution, allowing everyone to utilize power of animation and ultimate interactivity. AnyGantt is perfect for building complex and informative HTML5 Gantt charts.

AnyGantt is fully cross-browser and cross-platform. It can be used with ASP.NET, ASP, PHP, JSP, ColdFusion, Ruby on Rails or simple HTML pages. With AnyGantt you can visualize data from any warehouse: from files in text, Excel, CSV formats to MySQL, MS SQL, and Oracle database servers.

You can use server or desktop platform of your choice to create your application – AnyGantt will take care of charting. Right visualization helps you to turn your data into Right Decisions! If you need advanced, award-winning Gantt diagrams, then AnyGantt is the perfect solution for you.

Features:

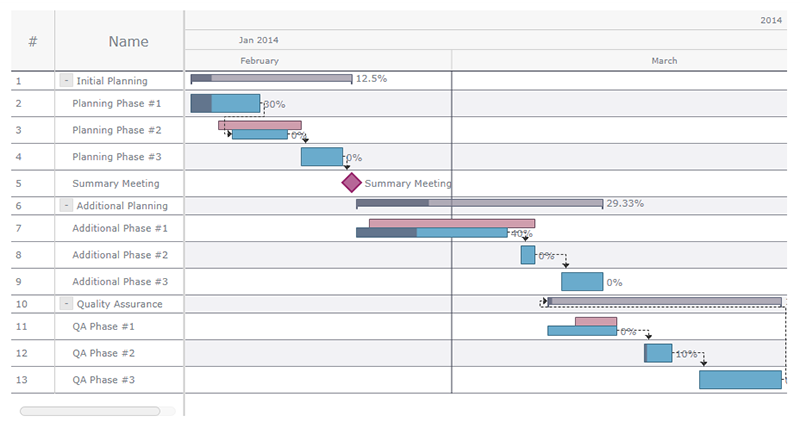
* AnyGantt supports Project (Task-based) and Schedule (Resource-based) Gantt charts for project planning, and PERT (Program Evaluation & Review Technique) charts for decision making – all with configurable Timeline, DataGrid, and other features.

* Style Based Visualization allows developers to focus on the business logic. Nicely designed defaults allow keeping design tasks away at all!

* For all text-based elements, such as labels, tooltips or data-grid columns AnyGantt features powerful formatting options.

* Data Grid that holds basic task or resource information is highly configurable. You can add any number of custom columns that can contain additional task or resource data. Each column can have custom text formatting, height and text style settings. Data grid itself can be redesigned to reflect important data specifics.

* Each element of AnyChart Gantt charts can be configured in its own way with a help of the flexible design system.

* AnyGantt is a JavaScript-based component, which can be used in any Web project. It doesn’t depend on any server-side platform, all you need is JavaScript enabled browser on client-side.

OrgChart JS 3.8.0

Type: Shareware
Cost: $399
Size: 39.00 kB
Release date: Oct 22 2018
Platform: WinXP,Win7 x32,Win7 x64,Windows 8,Windows 10,WinServer,WinOther,WinVista,WinVista x64,Linux,Linux Console,Linux Gnome,Linux GPL,Linux Open Source,Mac OS X,Android,iPhone,iPad,iOS
Publisher’s Site:  https://balkangraph.com
Publisher’s Product Page:  https://balkangraph.com/
Country: Bulgaria


OrgChart JS

OrgChart JS is designed for making neat flowcharts using HTML5, CSS, and JavaScript. Using server-side components, developers can implement a specially crafted editing interface. To create unique appearance for your app, you can make use of a set of default skins and color palettes or make your own set. If your users work with big diagrams, a search field which allows finding a particular item will serve as a handful tool.

The edit mode makes it easy to create and edit diagram items. All you have to do is type a name, title, some additional info, and OrgChart JSwill build your diagram automatically. If you work with a big data set, you can collapse your diagram leaving only the part you are working with. OrgChart JS has a zooming and scrolling features One of the best things about OrgChart JS is that it does not require any special programming skills due to simple configuration syntax.

OrgChart JS features the ability to build organization charts of any complexity. An organizational chart represents the most natural way of displaying the hierarchical structure of an organization. You can use it to show the structure of a company, business, or project team.

OrgChart JS allows you to export your chart/diagram to CSV or SVG using our export service.

OrgChart JS component consists of nodes and connectors. You can use nodes of some particular type: just textual, with an image or any other custom HTML and SVG elements, or create your own. Creation of a unique style for your diagram will be easy. The look and behavior are fully customizable, so you can set up any appearance you need via CSS or object properties.

You can easily integrate this OrgChart JS library in any web app. It supports the data loading in the JSON format, and can be used with any server-side back-end.

OrgChart JS 4.6.4

Type: Shareware
Cost: $399
Size: 47.00 kB
Release date: Apr 26 2019
Platform: WinXP,Win7 x32,Win7 x64,Windows 8,Windows 10,WinServer,WinOther,WinVista,WinVista x64,Linux,Linux Console,Linux Gnome,Linux GPL,Linux Open Source,Mac OS X,Android,iPhone,iPad,iOS
Publisher’s Site:  https://balkangraph.com
Publisher’s Product Page:  https://balkangraph.com/
Country: Bulgaria


OrgChart JS

OrgChart JS is designed for making neat flowcharts using HTML5, CSS, and JavaScript. Using server-side components, developers can implement a specially crafted editing interface. To create unique appearance for your app, you can make use of a set of default skins and color palettes or make your own set. If your users work with big diagrams, a search field which allows finding a particular item will serve as a handful tool.

The edit mode makes it easy to create and edit diagram items. All you have to do is type a name, title, some additional info, and OrgChart JSwill build your diagram automatically. If you work with a big data set, you can collapse your diagram leaving only the part you are working with. OrgChart JS has a zooming and scrolling features One of the best things about OrgChart JS is that it does not require any special programming skills due to simple configuration syntax.

OrgChart JS features the ability to build organization charts of any complexity. An organizational chart represents the most natural way of displaying the hierarchical structure of an organization. You can use it to show the structure of a company, business, or project team.

OrgChart JS allows you to export your chart/diagram to CSV or SVG using our export service.

OrgChart JS component consists of nodes and connectors. You can use nodes of some particular type: just textual, with an image or any other custom HTML and SVG elements, or create your own. Creation of a unique style for your diagram will be easy. The look and behavior are fully customizable, so you can set up any appearance you need via CSS or object properties.

You can easily integrate this OrgChart JS library in any web app. It supports the data loading in the JSON format, and can be used with any server-side back-end.