Category Archives: Web Development

ASP & PHP, E-Commerce, Flash Tools, HTML Tools, Java & JavaScript, Log Analysers, Other, Site Administration, Wizards & Components, XML/CSS Tools

AnyChart JS Charts and Dashboards 8.4.2

Type: Shareware
Cost: $49
Size: 23.12 MB
Release date: Nov 23 2018
Platform: WinXP,Win7 x32,Win7 x64,Windows 8,Windows 10,WinServer,WinOther,WinVista,WinVista x64,Linux,Linux Console,Linux Gnome,Linux GPL,Linux Open Source,Mac OS X,Android,iPhone,iPad,iOS
Publisher’s Site:  http://www.anychart.com
Publisher’s Product Page:  http://www.anychart.com/products/anychart/overview/
Country: United States of America


AnyChart JS Charts and Dashboards

AnyChart is a robust and superfast JavaScript charting library to add great-looking, interactive HTML5 charts into any project, in any browser, and on any platform/OS including mobile ones.

AnyChart provides advanced customization and flexibility opportunities, no matter if you are developing a website, a business intelligence application (BI) for corporate usage, or some software for your clients. Our JavaScript API makes it possible for you to create even big data based charts in real time, with continuous updates and multi-level drill-downs. Moreover, whatever server platform or database you use in your project, AnyChart is ready to fulfill your dream to surprise your customers with amazing informative JS charts and dashboards regardless of device – on Macs, laptops, PCs, smartphones, and tablets.

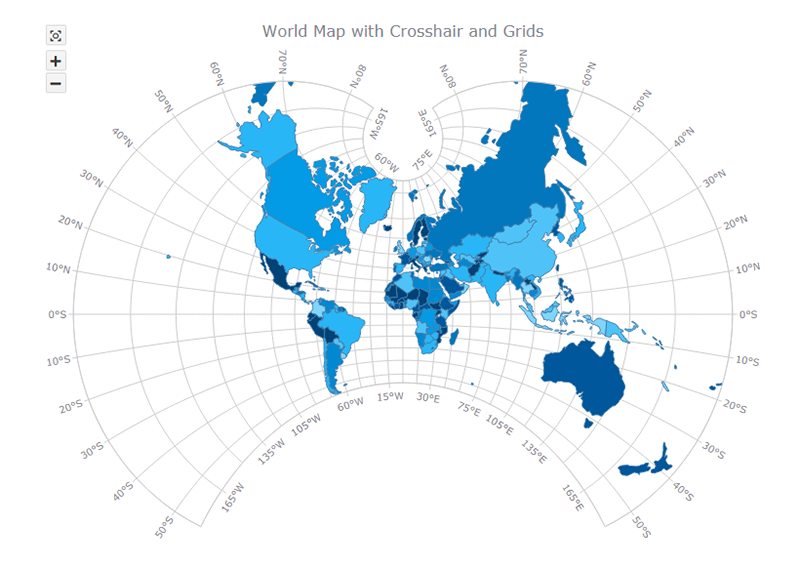
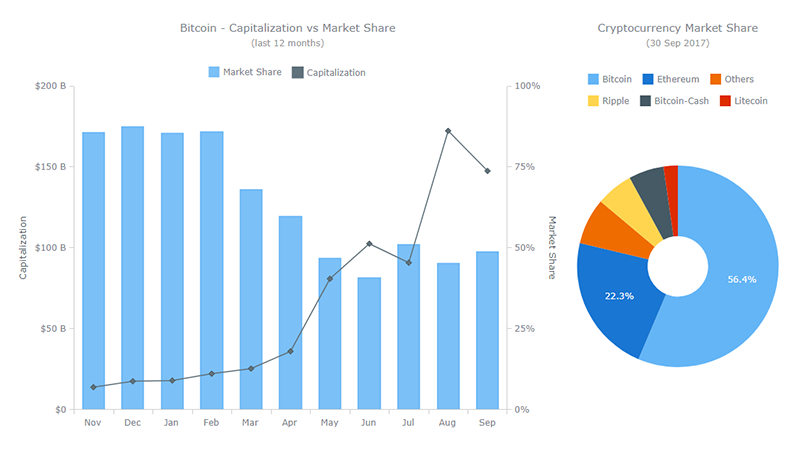
AnyChart provides scatter, line, bar, area, waterfall, spline, funnel, bubble, polar, column, column range, pie, box plot, linear and angular gauges, area spline range, Mekko, Venn, Sankey Diagram, waterfall, quadrant, tag cloud, and lots of other sorts of charts available separately and in combination, 2D and 3D.

In a nutshell, AnyChart HTML5 chart library’s advantages boil down to the following out-of-the-box features:
* 60+ chart types;
* chart design themes and color palettes;
* chart export to PDF, PNG, JPG, SVG, PS, chart data export to CSV and XLSX (Excel), social network sharing;
* many web app samples with interactive BI dashboards;
* localization engine (194 predefined locale files),
as well as advanced interactivity (tooltips on hover, drill-down, exclude data point, multi-selection, and more), multiple axes, async rendering, online chart editor, and much more to easily create beautiful interactive JS data visualization for any web projects.

GetOrgChart 2.5.3

Type: Demo
Cost: $99
Size: 615.00 kB
Release date: Nov 09 2018
Platform: WinXP,Win7 x32,Win7 x64,Windows 8,Windows 10,WinServer,WinOther,WinVista,WinVista x64,Linux,Linux Console,Linux Gnome,Linux GPL,Linux Open Source,Mac OS X,Android,iPhone,iPad,iOS
Publisher’s Site:  http://www.getorgchart.com/
Publisher’s Product Page:  http://www.getorgchart.com/
Country: Bulgaria


GetOrgChart

GetOrgChart lets developers create complex tree structures and then displays them as a beautiful flow chart using HTML 5, CSS, and JavaScript.

All the charts are fully customizable, and when used with a server-side component also allow developers to create and edit the charts using a specially crafted interface.

Various skins and color palettes are included with GetOrgChart by default, but the developers can also create their very themes as well.

In case GetOrgChart diagrams get too big, a built-in search field allows users to search for items, or the user can also use the table mode to view the raw data without the visual hierarchy.

GetOrgChart is offered for free for non-commercial projects, while a license needs to be purchased for larger, commercial applications.

AnyMap JS Maps 8.4.2

Type: Shareware
Cost: $49
Size: 23.12 MB
Release date: Nov 23 2018
Platform: WinXP,Win7 x32,Win7 x64,Windows 8,Windows 10,WinServer,WinOther,WinVista,WinVista x64,Linux,Linux Console,Linux Gnome,Linux GPL,Linux Open Source,Mac OS X,Android,iPhone,iPad,iOS
Publisher’s Site:  http://www.anychart.com
Publisher’s Product Page:  http://www.anychart.com/products/anymap/overview/
Country: United States of America


AnyMap JS Maps

AnyMap JS Maps is an advanced JavaScript/HTML5 mapping library which makes you able to easily create interactive maps that look great on any device including PCs, Macs, iPhones, iPads, Android devices and others – on any platform and in any browser.

AnyMap JS is perfect for interactive dashboards and side-by-side reporting. You can use it to display sales by region, election results, weather forecast, population density, and any other geo-related data.

AnyMap JS comes with our ready-to-use Map Collection which you can use at no additional cost. Maps are supplied in GeoJSON, which makes them flexible in working and editing. Custom maps can be created from any SHP map.

AnyMap JS maps are fully compatible with other AnyChart JS Charts’ HTML5 charting solutions – AnyChart JS (basic JavaScript charts), AnyStock JS (date/time JavaScript/HTML5 charts, e.g. financial and stock charts that visualize real-time data), and AnyGantt JS (JavaScript/HTML5 Gantt charts), and can be used both in a dashboard and as a standalone map visualization solution.

Features of AnyMap JS:

* Ever-expanding Map Collection with various country-specific and world maps.

* Highly customizable. Special reaction to certain events can be assigned with the help of event listeners.

* Wide variety of interactive options for your HTML5 maps, including tooltips, selection, hover, drill-down, etc.

* Support for various types of maps including Choropleth Map, Point (Dot) Map, Bubble Map, Connector Map, and Seat Map for displaying data related to geographic areas in HTML5 based web projects.

* Longitude/latitude support allows you to set coordinates (location) of Bubbles in Bubble JavaScript Charts in long/lat degrees. The API allows you to convert mouse coordinates to longitude and latitude (transform), and vice versa.

* Changing scale, moving map, and creating custom UI (buttons, scrolls, etc.) via API.

* Rich integration of keyboard and mouse controls.

* Map projections.