Category Archives: Web Development

ASP & PHP, E-Commerce, Flash Tools, HTML Tools, Java & JavaScript, Log Analysers, Other, Site Administration, Wizards & Components, XML/CSS Tools

AnyGantt JS Gantt Charts 8.4.2

Type: Shareware
Cost: $49
Size: 23.12 MB
Release date: Nov 23 2018
Platform: WinXP,Win7 x32,Win7 x64,Windows 8,Windows 10,WinServer,WinOther,WinVista,WinVista x64,Linux,Linux Console,Linux Gnome,Linux GPL,Linux Open Source,Mac OS X,Android,iPhone,iPad,iOS
Publisher’s Site:  http://www.anychart.com
Publisher’s Product Page:  http://www.anychart.com/products/anygantt/overview/
Country: United States of America


AnyGantt JS Gantt Charts

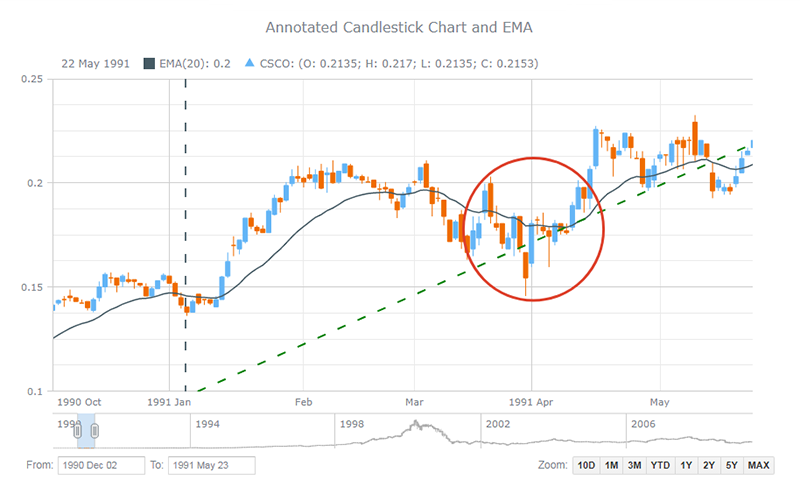
AnyGantt JS Gantt Charts library is an advanced JavaScript-based data visualization solution, allowing everyone to utilize power of animation and ultimate interactivity. AnyGantt is perfect for building complex and informative HTML5 Gantt charts.

AnyGantt is fully cross-browser and cross-platform. It can be used with ASP.NET, ASP, PHP, JSP, ColdFusion, Ruby on Rails or simple HTML pages. With AnyGantt you can visualize data from any warehouse: from files in text, Excel, CSV formats to MySQL, MS SQL, and Oracle database servers.

You can use server or desktop platform of your choice to create your application – AnyGantt will take care of charting. Right visualization helps you to turn your data into Right Decisions! If you need advanced, award-winning Gantt diagrams, then AnyGantt is the perfect solution for you.

Features:

* AnyGantt supports Project (Task-based) and Schedule (Resource-based) Gantt charts for project planning, and PERT (Program Evaluation & Review Technique) charts for decision making – all with configurable Timeline, DataGrid, and other features.

* Style Based Visualization allows developers to focus on the business logic. Nicely designed defaults allow keeping design tasks away at all!

* For all text-based elements, such as labels, tooltips or data-grid columns AnyGantt features powerful formatting options.

* Data Grid that holds basic task or resource information is highly configurable. You can add any number of custom columns that can contain additional task or resource data. Each column can have custom text formatting, height and text style settings. Data grid itself can be redesigned to reflect important data specifics.

* Each element of AnyChart Gantt charts can be configured in its own way with a help of the flexible design system.

* AnyGantt is a JavaScript-based component, which can be used in any Web project. It doesn’t depend on any server-side platform, all you need is JavaScript enabled browser on client-side.

Verj.io 2.0

Type: Shareware
Cost: $70
Size: 287.23 MB
Release date: Nov 09 2017
Platform: Win2000,WinXP,Win7 x32,Win7 x64,Windows 8,Windows 10,WinServer,WinOther,WinVista,WinVista x64
Publisher’s Site:  http://www.ebasetech.com
Publisher’s Product Page:  http://verj.io/overview/
Country: United Kingdom


Verj.io

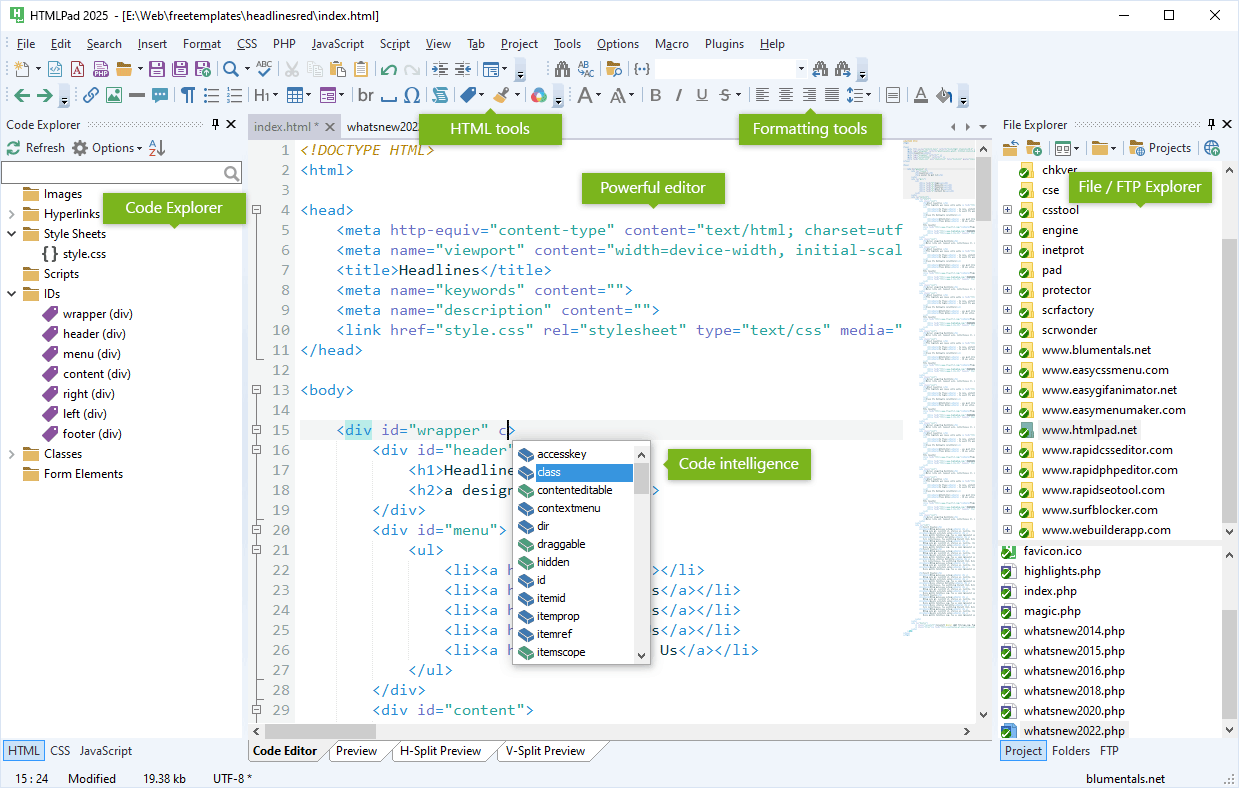
Rapid development of Low Code, IaaS and BaaS applications. Quickly develop and deploy sophisticated progressive web apps, data integration and workflow solutions. Delivers productivity by abstracting technical complexity. Supports 1-click Cloud deployment and run-time autoscaling.
Use cases include:
Bespoke Intranet and Internet browser application development;
Custom and bespoke software developments;
Progressive Web Apps;
Mobile browser apps;
Interactive single-page web apps;
Commercial software product development;
Offline mobile applications;
Electronic Forms and Form Automation;
Workflow processing and Business Process automation;
SOA, middleware and data integration solutions;
Digital Transformation;
Micro service development;
Publishing APIs;
IaaS and BaaS services for native mobile apps and 3rd party front-end web technologies;
IaaS services for connected devices;

AnyChart JS Charts and Dashboards 8.4.2

Type: Shareware
Cost: $49
Size: 23.12 MB
Release date: Nov 23 2018
Platform: WinXP,Win7 x32,Win7 x64,Windows 8,Windows 10,WinServer,WinOther,WinVista,WinVista x64,Linux,Linux Console,Linux Gnome,Linux GPL,Linux Open Source,Mac OS X,Android,iPhone,iPad,iOS
Publisher’s Site:  http://www.anychart.com
Publisher’s Product Page:  http://www.anychart.com/products/anychart/overview/
Country: United States of America


AnyChart JS Charts and Dashboards

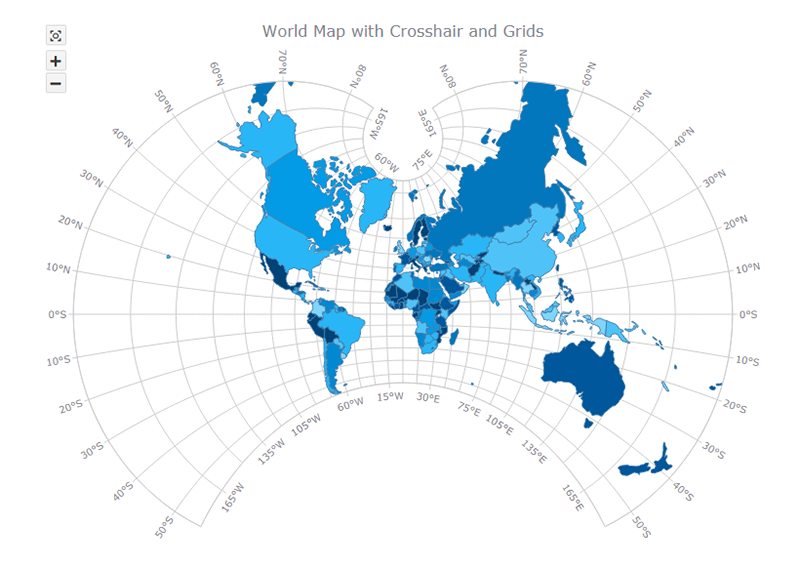
AnyChart is a robust and superfast JavaScript charting library to add great-looking, interactive HTML5 charts into any project, in any browser, and on any platform/OS including mobile ones.

AnyChart provides advanced customization and flexibility opportunities, no matter if you are developing a website, a business intelligence application (BI) for corporate usage, or some software for your clients. Our JavaScript API makes it possible for you to create even big data based charts in real time, with continuous updates and multi-level drill-downs. Moreover, whatever server platform or database you use in your project, AnyChart is ready to fulfill your dream to surprise your customers with amazing informative JS charts and dashboards regardless of device – on Macs, laptops, PCs, smartphones, and tablets.

AnyChart provides scatter, line, bar, area, waterfall, spline, funnel, bubble, polar, column, column range, pie, box plot, linear and angular gauges, area spline range, Mekko, Venn, Sankey Diagram, waterfall, quadrant, tag cloud, and lots of other sorts of charts available separately and in combination, 2D and 3D.

In a nutshell, AnyChart HTML5 chart library’s advantages boil down to the following out-of-the-box features:
* 60+ chart types;
* chart design themes and color palettes;
* chart export to PDF, PNG, JPG, SVG, PS, chart data export to CSV and XLSX (Excel), social network sharing;
* many web app samples with interactive BI dashboards;
* localization engine (194 predefined locale files),
as well as advanced interactivity (tooltips on hover, drill-down, exclude data point, multi-selection, and more), multiple axes, async rendering, online chart editor, and much more to easily create beautiful interactive JS data visualization for any web projects.