Category Archives: Web Development

ASP & PHP, E-Commerce, Flash Tools, HTML Tools, Java & JavaScript, Log Analysers, Other, Site Administration, Wizards & Components, XML/CSS Tools

AnyMap JS Maps 8.3.0

Type: Shareware
Cost: $49
Size: 23.06 MB
Release date: Jul 10 2018
Platform: WinXP,Win7 x32,Win7 x64,Windows 8,Windows 10,WinServer,WinOther,WinVista,WinVista x64,Linux,Linux Console,Linux Gnome,Linux GPL,Linux Open Source,Mac OS X,Android,iPhone,iPad,iOS
Publisher’s Site:  http://www.anychart.com
Publisher’s Product Page:  http://www.anychart.com/products/anymap/overview/
Country: United States of America


AnyMap JS Maps

AnyMap JS Maps is an advanced JavaScript/HTML5 mapping library which makes you able to easily create interactive maps that look great on any device including PCs, Macs, iPhones, iPads, Android devices and others – on any platform and in any browser.

AnyMap JS is perfect for interactive dashboards and side-by-side reporting. You can use it to display sales by region, election results, weather forecast, population density, and any other geo-related data.

AnyMap JS comes with our ready-to-use Map Collection which you can use at no additional cost. Maps are supplied in GeoJSON, which makes them flexible in working and editing. Custom maps can be created from any SHP map.

AnyMap JS maps are fully compatible with other AnyChart JS Charts’ HTML5 charting solutions – AnyChart JS (basic JavaScript charts), AnyStock JS (date/time JavaScript/HTML5 charts, e.g. financial and stock charts that visualize real-time data), and AnyGantt JS (JavaScript/HTML5 Gantt charts), and can be used both in a dashboard and as a standalone map visualization solution.

Features of AnyMap JS:

* Ever-expanding Map Collection with various country-specific and world maps.

* Highly customizable. Special reaction to certain events can be assigned with the help of event listeners.

* Wide variety of interactive options for your HTML5 maps, including tooltips, selection, hover, drill-down, etc.

* Support for various types of maps including Choropleth Map, Point (Dot) Map, Bubble Map, Connector Map, and Seat Map for displaying data related to geographic areas in HTML5 based web projects.

* Longitude/latitude support allows you to set coordinates (location) of Bubbles in Bubble JavaScript Charts in long/lat degrees. The API allows you to convert mouse coordinates to longitude and latitude (transform), and vice versa.

* Changing scale, moving map, and creating custom UI (buttons, scrolls, etc.) via API.

* Rich integration of keyboard and mouse controls.

* Map projections.

HTMLPad 2018 15.0

Type: Shareware
Cost: $59.95
Size: 48.55 MB
Release date: Apr 06 2018
Platform: Win2000,WinXP,Win7 x32,Win7 x64,Windows 8,Windows 10,WinServer,WinOther,WinVista,WinVista x64
Publisher’s Site:  https://www.blumentals.net/
Publisher’s Product Page:  https://www.htmlpad.net
Country: Latvia


HTMLPad 2018

HTMLPad is an intelligent all-in-one HTML, CSS and JavaScript editor that will help you code faster and become more productive. Packed with powerful tools and features, HTMLPad enables you to create, edit, validate, reuse, navigate and deploy your HTML, CSS and JavaScript code faster and easier than ever. HTMLPad includes full-blown CSS studio and a powerful JavaScript editing capabilities offering you the best package on the market today.

Features include:
* Full HTML5 and CSS3 compatibility
* Advanced, fully customizable and familiar text editor
* Light and dark interface theme
* UTF-8 Unicode support
* Syntax Highlighting for HTML, CSS, JavaScript, VBScript, PHP, ASP, Perl, XML, LESS, SASS
* Built-in multi-browser preview
* HTML and CSS validation
* Code Intelligence for HTML, CSS and JavaScript
* Code Inspector for HTML and CSS
* Code wizards and helpers
* Code snippet library
* Advanced color picker
* Project management
* FTP/SFTP/FTPS connectivity
* Mobile web development features
* Spelling checker
* Ready to use code templates
* Goto anything
* Find/Replace with regular expressions
* Find/Replace in files
* Multi-item clipboard
* Code folding
* Countless goodie features (bracket matching, line highlighting, text indentation…)

AnyStock Stock and Financial JS Charts 8.3.0

Type: Shareware
Cost: $49
Size: 23.06 MB
Release date: Jul 10 2018
Platform: WinXP,Win7 x32,Win7 x64,Windows 8,Windows 10,WinServer,WinOther,WinVista,WinVista x64,Linux,Linux Console,Linux Gnome,Linux GPL,Linux Open Source,Mac OS X,Android,iPhone,iPad,iOS
Publisher’s Site:  http://www.anychart.com
Publisher’s Product Page:  http://www.anychart.com/products/anystock/overview/
Country: United States of America


AnyStock Stock and Financial JS Charts

AnyChart Stock and Financial JS Charts (short: AnyStock) is a JavaScript based financial and stock charting library, also used for visualizing any timeline data over a long time. AnyStock technology turns your real-time data into highly sophisticated charts with interactive features, bringing visualization of your data to the Web and providing a full feature set for creating real-time streaming and data manipulation applications.

Designed to display date and time based information, AnyStock is the ideal tool for client reporting and performance reporting applications. Reports and Dashboards are visualized with scrolling, drill downs, panning and zoom functionality available in all of our HTML5 charts. AnyStock brings analysis of your FOREX, commodity and investment market data to life. The ability to review long term and large data sets can easily be handled with scroll, pan, and zoom controls.

AnyStock is fully integrated into AnyChart 7 Framework and shares most of its ideology, settings technique and ease of use – and you can use AnyStock along other charts including those available in the AnyChart JavaScript Charts, AnyGantt JavaScript Gantt Charts, and AnyMap JavaScript Maps.

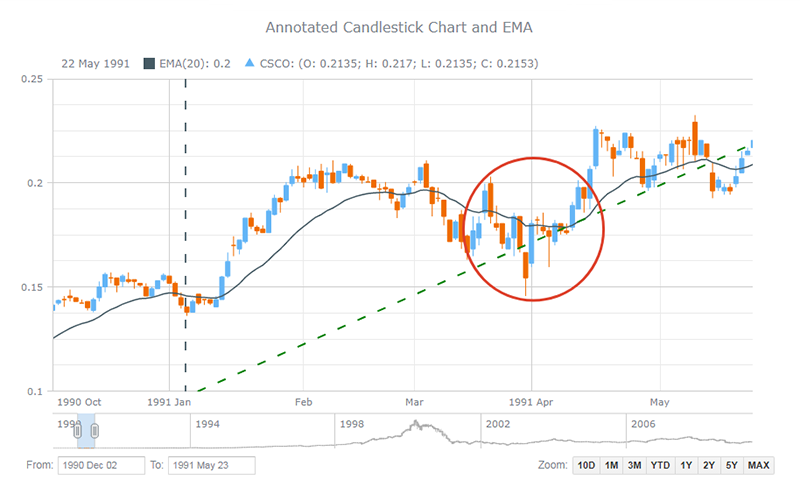
AnyStock supports a wide range of stock chart types (including Candlestick, OHLC, Line, Spline, Column, Step Line, Area, Step Area, Spline Area, Marker, Range Column, Range Area, Range Spline Area, Stacked Stock JS charts) and technical analysis indicators (MACD, ROC, RSI, SMA, EMA, DMI, CHO, CCI, and others; customs indicators can be set up). Drawing tools (including Line segment, Ray, Trend line, Trend channel, Andrew’s pitchfork, Fibonacci fan, Buy/Sell signals, and many others) and adding of news events (analyst opinions, insider trading, dividends, and key developments) to improve the ability to analyze information effectively are also available and have made an important contribution to the superfast HTML5 visualization of stock/financial or any timeline data w/ AnyStock JS.