Category Archives: Web Development

ASP & PHP, E-Commerce, Flash Tools, HTML Tools, Java & JavaScript, Log Analysers, Other, Site Administration, Wizards & Components, XML/CSS Tools

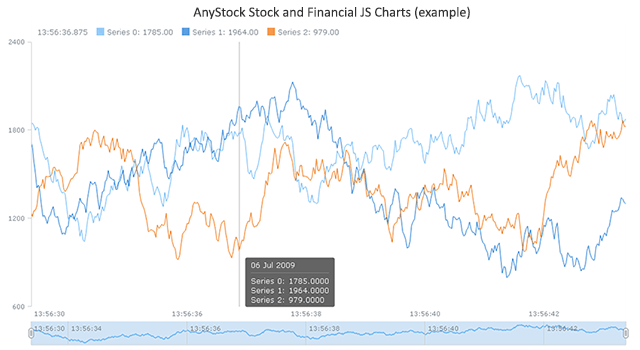
AnyStock Stock and Financial JS Charts 7.13.0

Type: Shareware
Cost: $49
Size: 1.62 MB
Release date: Feb 28 2017
Platform: WinXP,Win7 x32,Win7 x64,Windows 8,Windows 10,WinServer,WinOther,WinVista,WinVista x64,Linux,Linux Console,Linux Gnome,Linux GPL,Linux Open Source,Mac OS X,Android,iPhone,iPad,iOS
Publisher’s Site:  http://www.anychart.com
Publisher’s Product Page:  http://www.anychart.com/products/anystock/overview/
Country: United States of America


AnyStock Stock and Financial JS Charts

AnyChart Stock and Financial JS Charts (short name: AnyStock) is a JavaScript based financial and stock charting library. AnyStock technology turns your real-time data into highly sophisticated charts with interactive features, bringing visualization of your data to the Web and providing a full feature set for creating real-time streaming and data manipulation applications.

Designed to display date and time based information, AnyStock is the ideal tool for client reporting and performance reporting applications. Reports and Dashboards are visualized with scrolling, drill downs, panning and zoom functionality available in all of our HTML5 charts. AnyStock brings analysis of your FOREX, commodity and investment market data to life. The ability to review long term and large data sets can easily be handled with scroll, pan, and zoom controls.

AnyStock is fully integrated into AnyChart 7 Framework and shares most of its ideology, settings technique and ease of use – and you can use AnyStock along other charts including those available in the AnyChart JavaScript Charts, AnyGantt JavaScript Gantt Charts, and AnyMap JavaScript Maps.

AnyStock supports a wide range of stock chart types (including Candlestick, OHLC, Line, Spline, Column, Step Line, Area, Step Area, Spline Area, Marker, Range Column, Range Area, and Range Spline Area JS charts) and technical indicators (MACD, ROC, RSI, SMA, EMA, and custom). Drawing tools (including Line segment, Ray, Trend line, Trend channel, Andrew’s pitchfork, Fibonacci fan, Buy/Sell signals, and many others) and adding of news events (analyst opinions, insider trading, dividends, and key developments) to improve the ability to analyze information effectively are also available and have made an important contribution to the superfast HTML5 visualization of stock/financial data with AnyStock JS.

AnyGantt JS Gantt Charts 7.13.0

Type: Shareware
Cost: $49
Size: 1.51 MB
Release date: Feb 28 2017
Platform: WinXP,Win7 x32,Win7 x64,Windows 8,Windows 10,WinServer,WinOther,WinVista,WinVista x64,Linux,Linux Console,Linux Gnome,Linux GPL,Linux Open Source,Mac OS X,Android,iPhone,iPad,iOS
Publisher’s Site:  http://www.anychart.com
Publisher’s Product Page:  http://www.anychart.com/products/anygantt/overview/
Country: United States of America


AnyGantt JS Gantt Charts

AnyGantt JS Gantt Charts library is an advanced JavaScript based data visualization solution, allowing everyone to utilize power of animation and ultimate interactivity. AnyGantt is perfect for building complex and informative HTML5 Gantt charts.

AnyGantt is fully cross-browser and cross-platform. It can be used with ASP.NET, ASP, PHP, JSP, ColdFusion, Ruby on Rails or simple HTML pages. With AnyGantt you can visualize data from any warehouse: from files in text, Excel, CSV formats to MySQL, MS SQL, and Oracle database servers.

You can use server or desktop platform of your choice to create your application – AnyGantt will take care of charting. Right visualization helps you to turn your data into Right Decisions! If you need advanced, award winning Gantt diagrams, then AnyGantt is the perfect solution for you.

Features:

* AnyGantt supports Project (Task based) and Schedule (Resource based) Gantt charts for project planning, and PERT (Program Evaluation & Review Technique) charts for decision making – all with configurable Timeline, DataGrid, and other features.

* Style Based Visualization allows developers to focus on the business logics. Nicely designed defaults allow to keep design tasks away at all!

* For all text based elements, such as labels, tooltips or data-grid columns AnyGantt features powerful formatting options.

* Data Grid that holds basic task or resource information is highly configurable. You can add any number of custom columns that can contain additional task or resource data. Each column can have custom text formatting, height and text style settings. Data grid itself can be redesigned to reflect important data specifics.

* Each element of AnyChart Gantt charts can be configured in its own way with a help of the flexible design system.

* AnyGantt is a JavaScript based component, which can be used in any Web project. It doesn’t depend on any server-side platform, all you need is JavaScript enabled browser on client-side.

GraphicsJS 1.2.0

Type: Freeware
Cost: $0
Size: 418.00 kB
Release date: Feb 28 2017
Platform: WinXP,Win7 x32,Win7 x64,Windows 8,Windows 10,WinServer,WinOther,WinVista,WinVista x64,Linux,Linux Console,Linux Gnome,Linux GPL,Linux Open Source,Mac OS X,Android,iPhone,iPad,iOS
Publisher’s Site:  http://www.anychart.com
Publisher’s Product Page:  http://www.graphicsjs.org
Country: United States of America


GraphicsJS

GraphicsJS is a free and open-source JavaScript library for easily drawing absolutely anything including interactive and significantly more powerful in terms of out-of-the-box features than Raphael, Bonsai, and other existing SVG/VML based components.

Key features of GraphicsJS library making it stand out:
– Rich line drawing – not only Bezier curves, but also any deformations including arcs and other curves.
– Powerful text features – multiline texts, text measurement, including width, height, as well as wrap, overflow, indent, spacing, align, etc.
– Virtual DOM, designed for drawing rapidly and only what is necessary.
– Smart layering system including z-index.
– Its own transformation engine, with no need to use embarrassing in-browser transformations.
– Cross-browser support including legacy browsers (IE6+).
– Convenient JavaScript API, concise and with chaining support.

Developed and previously used as the graphics engine laid down in the foundation of the commercial charting libraries produced by AnyChart – AnyChart, AnyMap, AnyStock, and AnyGantt – GraphicsJS already operates data visualization solutions implemented by Oracle, Microsoft, Volkswagen, AT&T, Samsung, BP, Bosch, Merck, Reuters, Bank of China, Lockheed Martin, and thousands of other prominent customers of AnyChart, including over 70% of Fortune 1000 list companies.

Interactive data visualization is only one of multiple cases the rich GraphicsJS library can be used for. For instance, it also may be utilized for creating literally any images and graphics-related solutions and patterns including animated pictures, infographics, cartoons, and so on. Currently available demos include Galaxy, Rain, Bender from Futurama, Bonfire, 15-Puzzle, and more.