TSplus Server Monitoring 5.2.9

Product Page: https://tsplus-servermonitoring.com/

Server-Monitoring-Graph-1-800x600.png

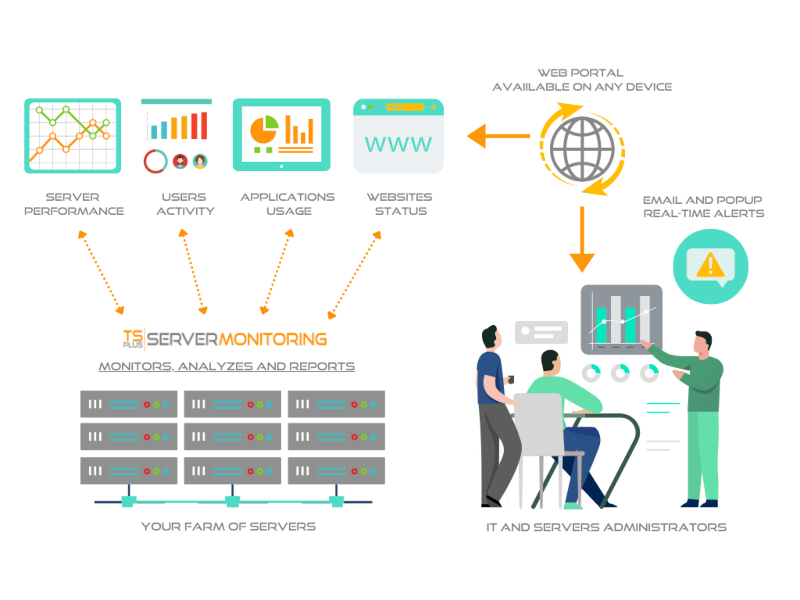
Server Monitoring is the smart monitoring and reporting solution to set up on your server(s). It tracks, records and analyzes users activity in every application, over Remote Desktop and Terminal Services connection method. With session recording, Server Monitoring records all user activity from the moment a user logs into a Windows machine via RDP or Terminal Server. It captures all activity taking place in the opened session over the time. Server Monitoring performance and applications’ analytics instantly alert IT teams to abnormal or suspicious user activity. It delivers an enterprise-scale porting of all terminal servers sessions, Citrix session and other standard remote control software in a compressed and searchable format. It checks websites performance, visits and stability and send real-time alarms in case of suspicious event that could lead to a failure. The result is a complete solution for identifying and managing your production’ environment. You can see the details of all Windows sessions, sorted and grouped according to each server. In many cases, this report list is already enough information for your auditing and troubleshooting needs. You can set customizable alerts regarding any sensitive, unusual, suspicious threshold you fixe and get proactive warnings to troubleshoot important issues faster. By making important events visible in real time, it is possible to quickly and effectively respond to any deliberate or inadvertent threats to IT security, system integrity, regulatory compliance or company policies. Overcome employee idleness with user activity monitoring. Never find yourself over- or under-licensed with license usage reports. Understand, Predict and avoid incident on yout servers at a glance: download Server Monitoring now for free!

Graphcat<

Flowrigami 1.0.0.3

Product Page: https://scand.com/products/flowrigami/

sceen1.jpg

Flowrigami is a free and open-source workflow editor, designed to visualize diverse workflows and configure them using graphic components. It works in two modes: View Mode and Edit Mode. A workflow consists of several nodes and connectors. Properties of nodes and connectors are defined by the user.
View Mode has:
Central working area, displaying the workflow itself and enabling users interaction with it.
Right area, displaying the properties of the selected node or connector.
Edit Mode has:
Left area with nodes and connectors library, allowing users to add new elements by dragging them from the library to central working area. This library can be customized by the user. The library contains different sets of objects defined for various diagram types (UML, BPMN, flowchart, etc.)
Central working area displaying the workflow itself and enabling users interaction with it.
Right area, displaying the properties of the selected node or connector and allowing a user to change these properties. Properties contain both visual ones and custom business properties defined by the user.
Flowrigami is configured for different diagram types: flowchart, BPMN, UML etc.
As component has both data format and settings format, the user can customize settings for his component online.

Sequentum Enterprise 2.74.9

Product Page: https://sequentum.com/products-overview

screenshot.png

Sequentum Enterprise is the leading enterprise web data extraction solution on the market today, with unparalleled support for large-scale operations. It has been specifically designed for corporations with a critical reliance on structured web data, legal compliance, quality and reliability.

It includes sophisticated features for monitoring data extraction success criteria, legal compliance and production fail-over that aren’t available in other solutions. Sequentum Enterprise includes the full suite of components to run large-scale web data extraction operations within your own cloud or data center environment.


Here’s a quick snapshot of why we think you’ll love it:

– Built from the ground up for optimal performance, scalability, compliance and reliability.
– Agent Control Center – provides centralized management of agents, servers, security, software upgrades, schedules, deployments, user access, proxies, support tickets, agent version control repository, and audit trail of any schedule or deployment changes.
– Intuitive visual editor which automatically detects and configures the required commands.
– Enterprise level debugging, logging, rich error detection and error handling controls with advanced retries and restarts config control.
– Fine grained data validation & success criteria that allows teams to specify rules on how to detect and handle data quality issues at runtime.
– Customized Chrome browser
– Data de-duplication.
– Device fingerprint anonymization.
– Robust proxy rotation across sessions.
– Rate limits.
– Sophisticated parser handling, multi-threading and session management.
– Rich API that exposes the myriad points of integration teams need.
– Diverse export targets (i.e. Parquet, JSON).
– Diverse delivery methods (Amazon AWS S3, Azure, Cosmos DB, SFTP).
– Most databases are supported (i.e. including PostGreSQL, MongoDB, etc.).
– Upgrade of software is supported by remote control.