FileToFolder 5.5.0

Product Page: https://www.thecodeline.com/products/filetofolder/

FTF_Homepage800x600.png

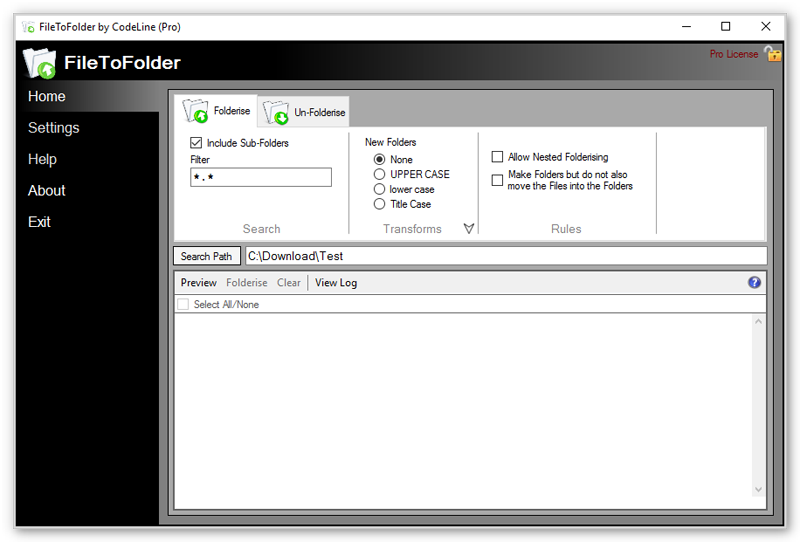
Providing easy, one-click folder creation from a file and moving that file into its new folder. Need to do the opposite and rapidly move multiple files out of their folders into the current folder? FileToFolder will do that too with a simple ‘right-click’ call from the context menu, while tidying up behind itself and deleting the empty folders and sub-folders if required. FileToFolder is at its most convenient when used from the context menu in Windows Explorer but it can be opened and used as a conventional application as well or run from the command line with control parameters.

Graphcat<

Icons8 Lunacy 8.5

Product Page: https://icons8.com/lunacy

3232512X512.png

Lunacy is a vector graphic software for UI/UX and web design. It’s faster than Figma, smarter than Sketch!

100% FREE
Lunacy is absolutely free for personal and commercial use.


CROSS-PLATFORM APP
Lunacy runs on Windows, macOS, and Linux.

REAL-TIME COLLABORATION
Users working on different platforms can collaborate over the same design in real-time.

LOW SYSTEM REQUIREMENTS
Lunacy is not demanding on hardware and runs smoothly even on moderate laptops.

BUILT-IN GRAPHICS
Icons
Photos
Illustrations

AI-POWERED TOOLS ONBOARD
Background remover
Image upscaler
Avatar generator
Text generator

WORKS ONLINE AND OFFLINE
You can work both with cloud and local documents. It’s up to you to choose. You can switch between the cloud and local modes whenever you want.

MINIMUM LEARNING CURVE
If you have experience with Sketch or Figma, in Lunacy youll feel like home.

FULL SUPPORT FOR SKETCH FILES
Open
Edit
Save

NO BOUNDS
Thanks to the native support for the Sketch format, you can use Lunacy with all major hand-off and version control tools like Avocode, Zeplin, Abstract, Simpli, etc.
If it is necessary, you can easily import .sketch files to Figma or XD.

ZENPLOT 1.1.0.158

Product Page: https://www.zenplot.com/en

a320b93bbaa733fde25e880dfe8bece9c5a7dfbb.png

ZENPLOT, the data visualization software dedicated to advanced graphics
ZENPLOT allows you to create impactful visualizations by stacking different graphic layers (histograms, scatterplots, line charts, bar charts, heatmap / 2D surface, area chart, labels, annotations, axis, legend etc.). The data can be linked to any characteristic of the different layers (color, shapes, etc.).
The user also has the option of annotating visualizations with images, text or shapes while navigating through a user-friendly interface. Each graphic is then exportable to vectorial or standard format.
ZENPLOT is available on PC and Mac, and its simple and intuitive interface requires very little learning.
Your visualizations can be exported in different formats (.PNG, .SVG, et cetera) so that you can include them in presentations. You can also share your projects and visualization templates simply by saving them in the .ZEN format.
A project can be made up of one or more visualizations, which in turn are made up of one or more layers linked to one or more datasets.
Each feature of each element of the visualization can be customized. (for example: size, color, shape of a point). There are two ways to do this: uniformly for the layer or by linking it to a variable.
ZENPLOT integrates different themes that will allow you to style visualizations in the blink of an eye.
In ZENPLOT, you can annotate your visualization with shapes , texts, or images for a maximum of creative freedom. You can also customize to a high degree the reading axes and the legend of the visualization.