Tag Archives: organizational chart

MyDraw 5.4

Product Page: https://www.mydraw.com/downloads-download

MindMapBusinessPlan.png

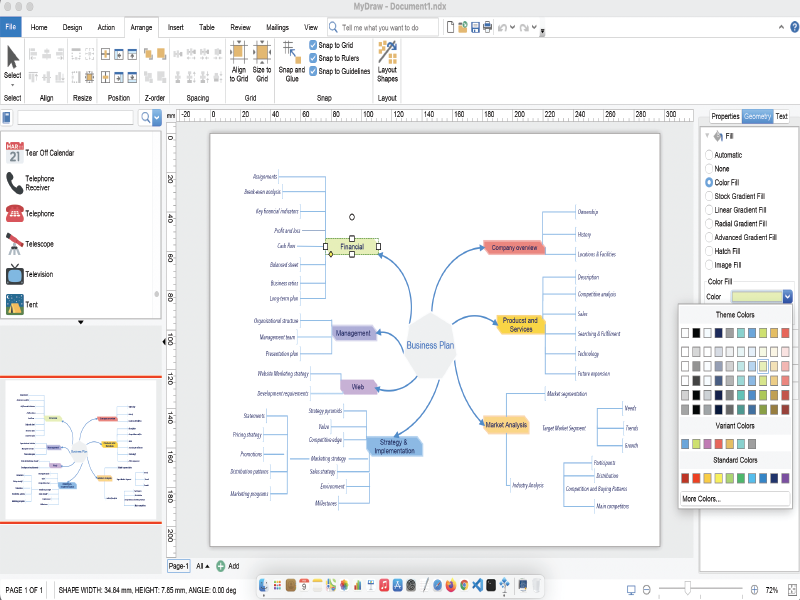
MyDraw for Mac is an advanced diagramming software and vector graphics drawing tool. This diagram software includes powerful features to help you create flowcharts, org charts, mind maps, network diagrams, floor plans, family tree diagrams, general business diagrams, vector drawings, flyers, certificates and others.
Following are the major features of the application:
-100+ Diagram Examples and Templates – includes many ready-to-use templates for flowcharts, organizational charts, flyers, certificates & business cards, family tree diagrams and many other diagram types.
-700+ Diagram Shapes and Symbols – more than 700 predefined shapes organized in 25 shape libraries.
-MS Visio Compatibility – MyDraw is the best Microsoft Visio alternative for macOS (Mac OS X). You can use it to view, edit and save your Visio Drawing (VSDX) and Visio 2003-2010 Drawing (VSD, VDX) files. MyDraw can also be used a Visio viewer. You can also import and export Visio Stencils (VSSX) and Visio 2003-2010 Stencils (VSS, VSX).
-Automatic Diagram Layouts – lots of automatic layouts to help you quickly arrange your diagrams
-Powerful Rich Text Support – powerful support for rich text and text formatting. You have full control over the text font, text styles, paragraph alignment, bullets and numbering, images, etc.
-Advanced Table Support – support for tables with master cells, multi cell selection, text orientation etc.
-Spell Check and Proofing Languages
-Import of map data from ESRI shapefiles.
-Support for creating and inserting in your diagrams more than 30 types of linear and matrix barcodes like EAN-13, UPC, UPC-A, Code-39, Code-128, ISBN, PDF417, Data Matrix, QR Code, etc.
-GEDCOM Format Family Trees – the software supports importing from and exporting to GEDCOM format. This makes it the perfect tool for drawing family tree diagrams.
-Export to PDF, SVG, EMF+, PNG, JPEG and BMP.
-Import from SVG, WMF, EMF, EMF+, PNG, JPEG and BMP.
-Windows and Mac versions.

MyDraw 5.3.0

Product Page: https://www.mydraw.com/downloads-download

MindMapBusinessPlan.png

MyDraw for Mac is an advanced diagramming software and vector graphics drawing tool. This diagram software includes powerful features to help you create flowcharts, org charts, mind maps, network diagrams, floor plans, family tree diagrams, general business diagrams, vector drawings, flyers, certificates and others.
Following are the major features of the application:
-100+ Diagram Examples and Templates – includes many ready-to-use templates for flowcharts, organizational charts, flyers, certificates & business cards, family tree diagrams and many other diagram types.
-700+ Diagram Shapes and Symbols – more than 700 predefined shapes organized in 25 shape libraries.
-MS Visio Compatibility – MyDraw is the best Microsoft Visio alternative for macOS (Mac OS X). You can use it to view, edit and save your Visio Drawing (VSDX) and Visio 2003-2010 Drawing (VSD, VDX) files. MyDraw can also be used a Visio viewer. You can also import and export Visio Stencils (VSSX) and Visio 2003-2010 Stencils (VSS, VSX).
-Automatic Diagram Layouts – lots of automatic layouts to help you quickly arrange your diagrams
-Powerful Rich Text Support – powerful support for rich text and text formatting. You have full control over the text font, text styles, paragraph alignment, bullets and numbering, images, etc.
-Advanced Table Support – support for tables with master cells, multi cell selection, text orientation etc.
-Spell Check and Proofing Languages
-Import of map data from ESRI shapefiles.
-Support for creating and inserting in your diagrams more than 30 types of linear and matrix barcodes like EAN-13, UPC, UPC-A, Code-39, Code-128, ISBN, PDF417, Data Matrix, QR Code, etc.
-GEDCOM Format Family Trees – the software supports importing from and exporting to GEDCOM format. This makes it the perfect tool for drawing family tree diagrams.
-Export to PDF, SVG, EMF+, PNG, JPEG and BMP.
-Import from SVG, WMF, EMF, EMF+, PNG, JPEG and BMP.
-Windows and Mac versions.
BALKAN OrgChartJS 8.04

Product Page: https://balkan.app/

screenshot-orgchart-js.png

OrgChart JS is designed for making neat flowcharts using HTML5, CSS, and JavaScript. Using server-side components, developers can implement a specially crafted editing interface. To create unique appearance for your app, you can make use of a set of default skins and color palettes or make your own set. If your users work with big diagrams, a search field which allows finding a particular item will serve as a handful tool.
The edit mode makes it easy to create and edit diagram items. All you have to do is type a name, title, some additional info, and OrgChart JS will create or edit the item and rebuild your diagram automatically. If you work with a big data set, you can collapse your diagram leaving only the part you are working with. OrgChart JS has a zooming and scrolling features One of the best things about OrgChart JS is that it does not require any special programming skills due to simple configuration syntax.
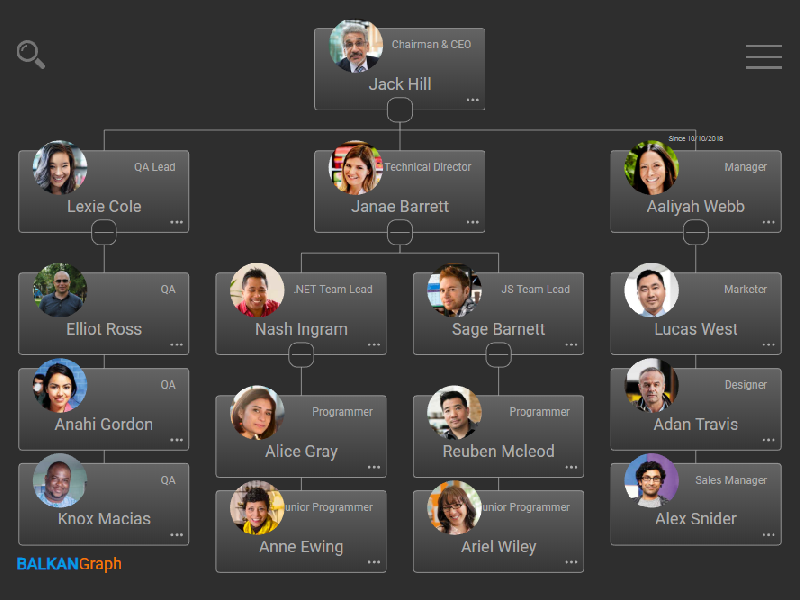
OrgChart JS features the ability to build organization charts of any complexity. An organizational chart represents the most natural way of displaying the hierarchical structure of an organization. You can use it to show the structure of a company, business, or project team.
OrgChart JS allows you to export your chart/diagram to PDF, PNG, CSV or SVG using our export service. You could also install your own export service.
OrgChart JS component consists of nodes and connectors. You can use nodes of some particular type: just textual, with an image or any other custom HTML and SVG elements, or create your own. Creation of a unique style for your diagram will be easy. The look and behavior are fully customizable, so you can set up any appearance you need via CSS or object properties.
You can easily integrate this OrgChart JS library in any web app. It supports the data loading in the JSON format, and can be used with any server-side back-end.
OrgChart JS supports unlimited number of sub trees in one chart object and two states of a node.